Telescope Advisor Logo Telescope Advisor
The aurora borealis — vivid green northern lights photographed by NASA, showing curtains of light in the night sky

Aurora Forecasting · Complete Guide

KP Index Explained: How to Read the Aurora Forecast Like a Pro

The Kp index is the single most important number for aurora chasers — it tells you how far south the northern lights will reach. Here's how to read it, what Kp level you need for your location, and how to set up alerts so you never miss a display.

Kp 5 = G1 StormAurora to US-Canada border
Kp 7 = G3 StormAurora to Denver, Chicago
Kp 9 = G5 StormAurora to Florida, Texas
Solar Max 2026Kp 5+ several times/year
By Elena Reyes Published: Updated: Reviewed & approved by Juhi Sahni, Senior Editor Editorial Standards

Quick Answer: What Kp Index Do I Need to See the Northern Lights?

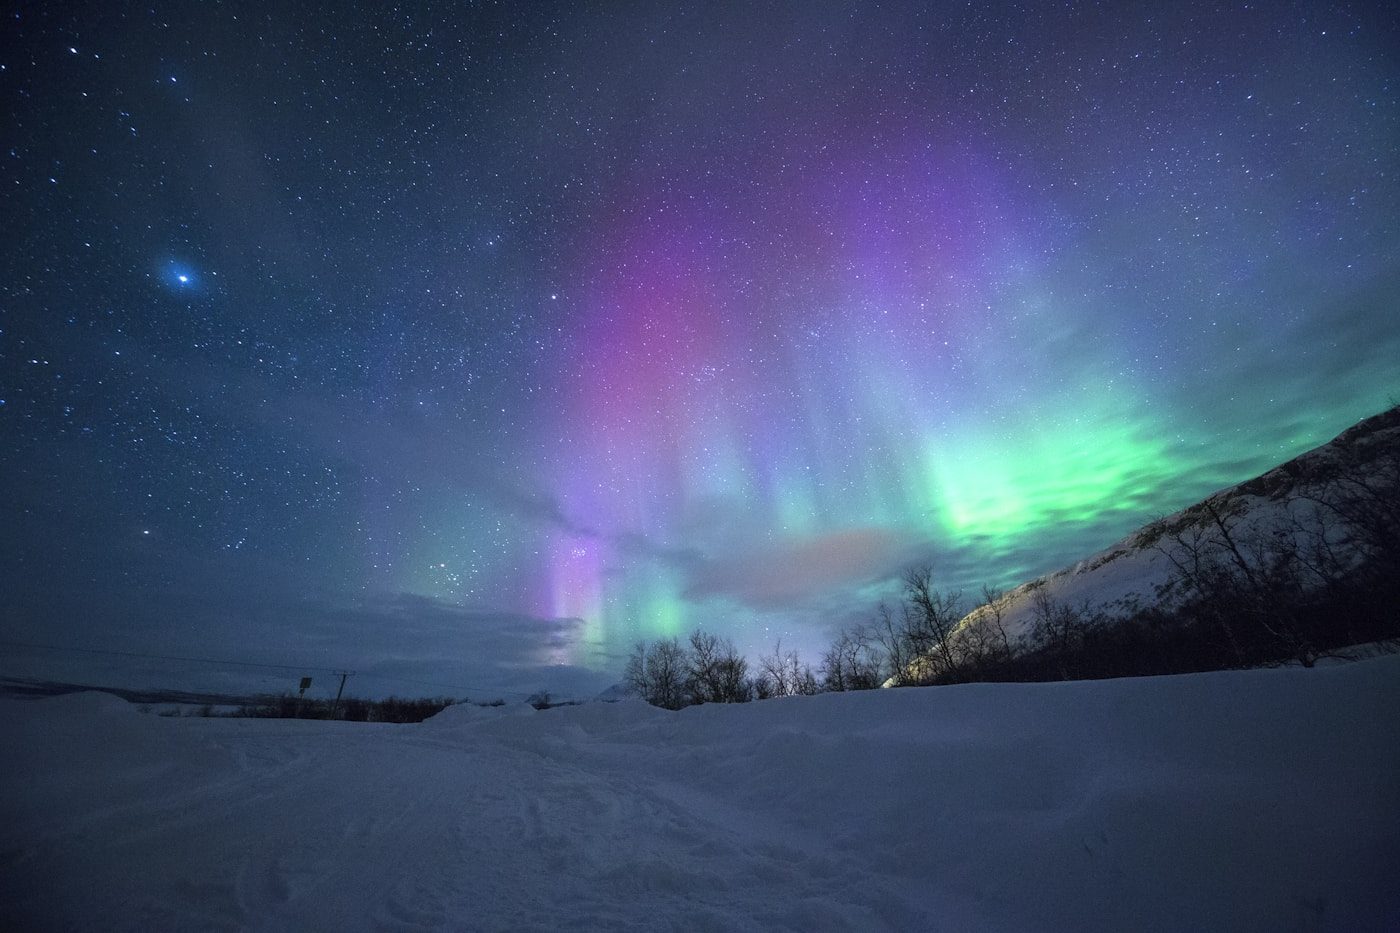
The Kp index measures global geomagnetic activity on a 0–9 scale. The higher the Kp, the farther south the aurora reaches. For most of the continental US, you need at least Kp 5–6 for a visible display; for locations like Colorado or Ohio, Kp 6–7; for Florida or Texas, Kp 8–9. During Solar Cycle 25's peak in 2026, Kp 5–6 conditions occur multiple times per year, and Kp 7+ events are possible once or twice annually.

The Kp index is published in real time by NOAA's Space Weather Prediction Center (SWPC). You can check the current Kp on their website, in the OVATION aurora model, or through apps like SpaceWeatherLive. When Kp reaches the threshold for your location, go outside, find a dark sky with an unobstructed northern horizon, and look up.

Check tonight's aurora forecast →


What Is the Kp Index?

The Kp index (from the German "planetarische Kennziffer" — planetary index) is a global measure of geomagnetic activity developed by Julius Bartels in 1939. It quantifies the disturbance of Earth's magnetic field caused by the solar wind and, most importantly for aurora chasers, by coronal mass ejections (CMEs) and high-speed solar wind streams from coronal holes.

The index runs from 0 to 9, where 0 represents complete magnetic calm and 9 represents an extreme geomagnetic storm. Each whole-number increase represents roughly a doubling of magnetic disturbance. The Kp index is derived from measurements at 13 ground-based magnetometer stations around the world, updated every three hours.

For aurora observers, Kp is the single most practical forecasting tool because it correlates directly with how far south the auroral oval extends. When Kp is 0–2, the aurora is confined to polar regions (Alaska, Canada, Scandinavia). At Kp 7+, it can reach the southern United States. This direct relationship makes Kp the go-to number for deciding whether to drive to a dark site tonight.

Kp vs the auroral oval

The auroral oval — the ring-shaped zone where aurora occurs — is always present around both magnetic poles. As Kp rises, the oval expands southward. At Kp 5, it reaches the northern US states. At Kp 7, it covers the middle of the country. At Kp 9, it stretches into the subtropics. This expansion is what makes Kp the most useful forecast number.


Kp Needed for Your Location — State-by-State Guide

The Kp level you need depends on your latitude. Here's a quick-reference table for US states. These are approximate — local light pollution, sky clarity, and the exact position of the auroral oval all affect visibility.

Kp Level G-Scale States Where Aurora Is Visible Frequency at Solar Max
Kp 0–2 Quiet Alaska only Daily (background level)
Kp 3–4 Unsettled to Active Alaska, Canada border states (WA, MT, ND, MN, WI, MI, ME) Several times per month
Kp 5 G1 (Minor) Northern tier: WA, OR, ID, MT, WY, ND, SD, MN, WI, MI, NY, VT, NH, ME. Faintly visible as far south as NE, IA, IL, OH, PA, MA 2–5 times per month
Kp 6 G2 (Moderate) Mid-latitude: OR to ME line, plus CO, UT, NE, KS, MO, IL, IN, OH, KY, WV, VA, MD, NJ, CT, RI. Visible to ~45°N latitude. 5–10 times per year
Kp 7 G3 (Strong) Central US: CA, NV, AZ, NM, CO, OK, AR, TN, NC, SC. Visible to ~40°N latitude. 2–4 times per year
Kp 8 G4 (Severe) Southern US: TX, LA, MS, AL, GA, FL panhandle, SC. Visible to ~35°N latitude. Once per 1–2 years
Kp 9 G5 (Extreme) Extreme southern US: FL, southern TX, southern CA, Gulf Coast. Visible to ~30°N latitude. 1–2 per solar cycle (rare)

Note that Kp indicates the maximum potential extent — actual visibility depends on local factors. A Kp 6 storm might produce vivid aurora for observers in Colorado while barely a glow for someone in New York City with bright light pollution. Dark skies matter as much as Kp.

The aurora borealis — the Kp index determines how far south these green curtains of light will be visible

Aurora Borealis — Kp Index Determines Visibility

The Kp index is the most important number for aurora chasers. At Kp 5, the auroral oval reaches the US-Canada border. At Kp 7, it reaches Denver and Chicago. At Kp 9, it can reach Florida. Credit: NASA.

For state-specific guidance, see our dedicated guides: Colorado, Ohio, and Best Places USA.

How to Read the NOAA 3-Day Kp Forecast

NOAA's Space Weather Prediction Center publishes a rolling 3-day Kp forecast updated every 8 hours (00:00, 08:00, 16:00 UTC). Here's how to interpret it:

Forecast Element What It Shows How to Use It
3-Day Kp Forecast Graph Predicted Kp in 3-hour blocks for the next 3 days Look for peaks reaching your Kp threshold. Plan observing sessions around peak times.
Estimated Kp (now) Current real-time Kp from ground stations If it's already at your threshold, go outside immediately.
OVATION Model Visual map showing aurora oval extent right now The most intuitive tool — shows the green oval overlaid on a map. If your state is under the oval, go look.
Probability Forecasts Chance of Kp 5, 6, 7 reaching certain latitudes Higher probability = more confidence to plan a trip to a dark site.

Good Kp for your area? Here's what to do

1. Check local cloud cover forecast
2. Find a dark site with unobstructed northern horizon
3. Arrive before peak Kp time (check hour-by-hour)
4. Give your eyes 15 minutes to dark-adapt
5. Look north — aurora often starts as a pale green glow below the Big Dipper

Caveats to know

The 3-day forecast has ~50% accuracy at best — CME arrival times are hard to predict. The 1-day forecast is better (~70%). The best predictor is the real-time Kp and solar wind data from the DSCOVER satellite, which gives about 30–60 minutes of lead time before a CME hits Earth's magnetosphere.

How to Set Up Kp Alerts — Never Miss an Aurora

The best aurora chasers don't constantly refresh the NOAA website — they set up automated alerts. Here's how:

📱

SpaceWeatherLive App (iOS/Android)

Set push notifications for Kp thresholds. Recommended: notify at Kp 5 with a 3-hour ahead forecast. The app also alerts on X-class flares, which are the earliest warning of potential CME arrivals 1–3 days later. Free with optional premium tier.

💻

NOAA SWPC Email Alerts

Subscribe at swpc.noaa.gov/subscribe for free email alerts when Kp reaches specified thresholds. You can set separate alerts for Kp 5, 6, 7, and 8. Emails arrive within minutes of a threshold being crossed.

🌐

Aurora Alerts Dashboard

Websites like aurora-alerts.com and softservenews.com offer SMS and email alerts for specific US states. When Kp reaches your state's threshold, you get a text message. Premium services start at ~$5/month.

My recommended alert strategy

Set three alerts: (1) X-class flare detection — earliest possible warning (1–3 days ahead). (2) Kp 5 forecast — get ready to observe. (3) Kp 6+ real-time — drop everything and go outside. This gives you a cascade from "maybe" to "definitely" with time to plan.

G-Scale Geomagnetic Storms — What Each Level Means for You

NOAA uses a G-scale (G1–G5) for geomagnetic storms that parallels the Kp index. G1 corresponds to Kp 5, G2 to Kp 6, and so on up to G5 at Kp 9. While the Kp index tells you the intensity, the G-scale describes the effects — power grid fluctuations, satellite navigation issues, and of course, aurora visibility.

Scale Kp Equivalent Effects on Earth Aurora Visibility
G1 (Minor)Kp 5Weak grid fluctuations, minor satellite impactNorthern border states — Maine to Washington
G2 (Moderate)Kp 6High-latitude power systems affected, satellite drag increasesMid-latitude — Colorado to New York line
G3 (Strong)Kp 7Voltage corrections needed, possible satellite surface chargingCentral US — to ~40°N (Denver, Chicago, NYC)
G4 (Severe)Kp 8Widespread voltage control problems, satellite orientation issuesSouthern US — to ~35°N (Dallas, Atlanta, LA)
G5 (Extreme)Kp 9Widespread grid collapse possible, satellite systems severely affectedExtreme — to ~30°N (Florida, Texas, Gulf Coast)

Historic G5 Event: The 2024 Halloween Storms

The last G5 geomagnetic storm occurred in May 2024 (the "2024 Mother's Day Storm"), producing aurora visible as far south as Jamaica and the Bahamas. It was the strongest geomagnetic storm since the 2003 Halloween storms. During Solar Cycle 25, G4–G5 events remain possible through 2027.

Beyond Kp: Bz, Solar Wind Speed, and Density

Kp is the best summary number, but advanced aurora chasers also watch three real-time solar wind parameters. These are measured by the DSCOVER satellite at the L1 Lagrange point, about 1 million miles from Earth, giving 30–60 minutes of warning before a CME arrives.

Bz (North-South IMF)

The most important real-time number. Bz is the orientation of the interplanetary magnetic field (IMF). When Bz turns strongly southward (negative, below −10 nT), it connects with Earth's northward-pointing magnetic field, funneling solar wind energy into the magnetosphere and supercharging the aurora. A southward Bz is often the trigger that turns a Kp 5 forecast into a Kp 7 reality.

Solar Wind Speed

The speed of the solar wind measured in km/s. Background solar wind is ~350–400 km/s. CMEs arrive with speeds of 500–3,000 km/s. Higher speed means more energy hitting Earth's magnetosphere. Speeds above 500 km/s generally indicate disturbed conditions.

Particle Density

The number of solar wind particles per cubic centimeter. Background is ~5–10 protons/cm³. CMEs show elevated density (20–50+ protons/cm³) followed by a sharp drop as the CME passes. Combined with high speed and southward Bz, high density produces the strongest aurora.

Pro tip: The "three strikes" rule

The strongest aurora events occur when all three conditions align: solar wind speed >500 km/s, Bz < −10 nT, and density >20 protons/cm³. When you see this combination on SpaceWeatherLive, you have a 30–60 minute window to get to your observing site. Don't wait — go immediately.

Frequently Asked Questions About the Kp Index

What does Kp stand for?

Kp stands for "planetarische Kennziffer" (planetary index in German). It was developed in 1939 by German geophysicist Julius Bartels as a standardized global measure of geomagnetic activity, derived from magnetometer readings at 13 stations worldwide.

What Kp do I need to see the aurora from my location?

Kp 3–4 for northern border states (WA, MN, MI, ME); Kp 5–6 for the northern third of the US; Kp 6–7 for the mid-latitude band (Denver, Chicago, New York); Kp 7–8 for the southern US; Kp 8–9 for Gulf Coast and Florida. Use the state-by-state table above for your exact location.

Is the Kp forecast accurate?

The 3-day Kp forecast has roughly 50% accuracy. The 1-day forecast is better (~70%). The most reliable indicator is the real-time solar wind data from the DSCOVER satellite combined with the current Kp. CME arrival times remain the hardest variable to predict accurately.

What is the difference between Kp and Ap index?

Kp is a quasi-logarithmic 0–9 scale published every 3 hours. Ap is a linear daily average derived from Kp values. For aurora chasing, Kp is more useful because it shows hourly changes. Ap is better for long-term trend analysis and research.

Can the Kp index predict aurora color?

Indirectly. Stronger storms (higher Kp) produce more energetic particles that penetrate deeper into the atmosphere, creating red aurora at higher altitudes and green at lower altitudes. At Kp 7+, you're more likely to see vivid reds and purples alongside the familiar green.

How often does Kp 7+ occur during solar maximum?

During Solar Cycle 25's peak (2025–2027), Kp 7 (G3) conditions occur approximately 2–4 times per year. Kp 8 (G4) occurs roughly once every 1–2 years. Kp 9 (G5) is rare — the last occurred in May 2024, and before that, the 2003 Halloween storms.